
Marketing without reporting is a guess. Marketing with ten dashboards is confusion.
Organic traffic, paid media, and competitors side by side, in a dashboard the operation keeps updated for you. The analysis arrives already interpreted in the weekly check-in: what worked, what burned budget, and where to invest next.

The answer wasn't missing from some spreadsheet. It was sitting in the next tab nobody opened.
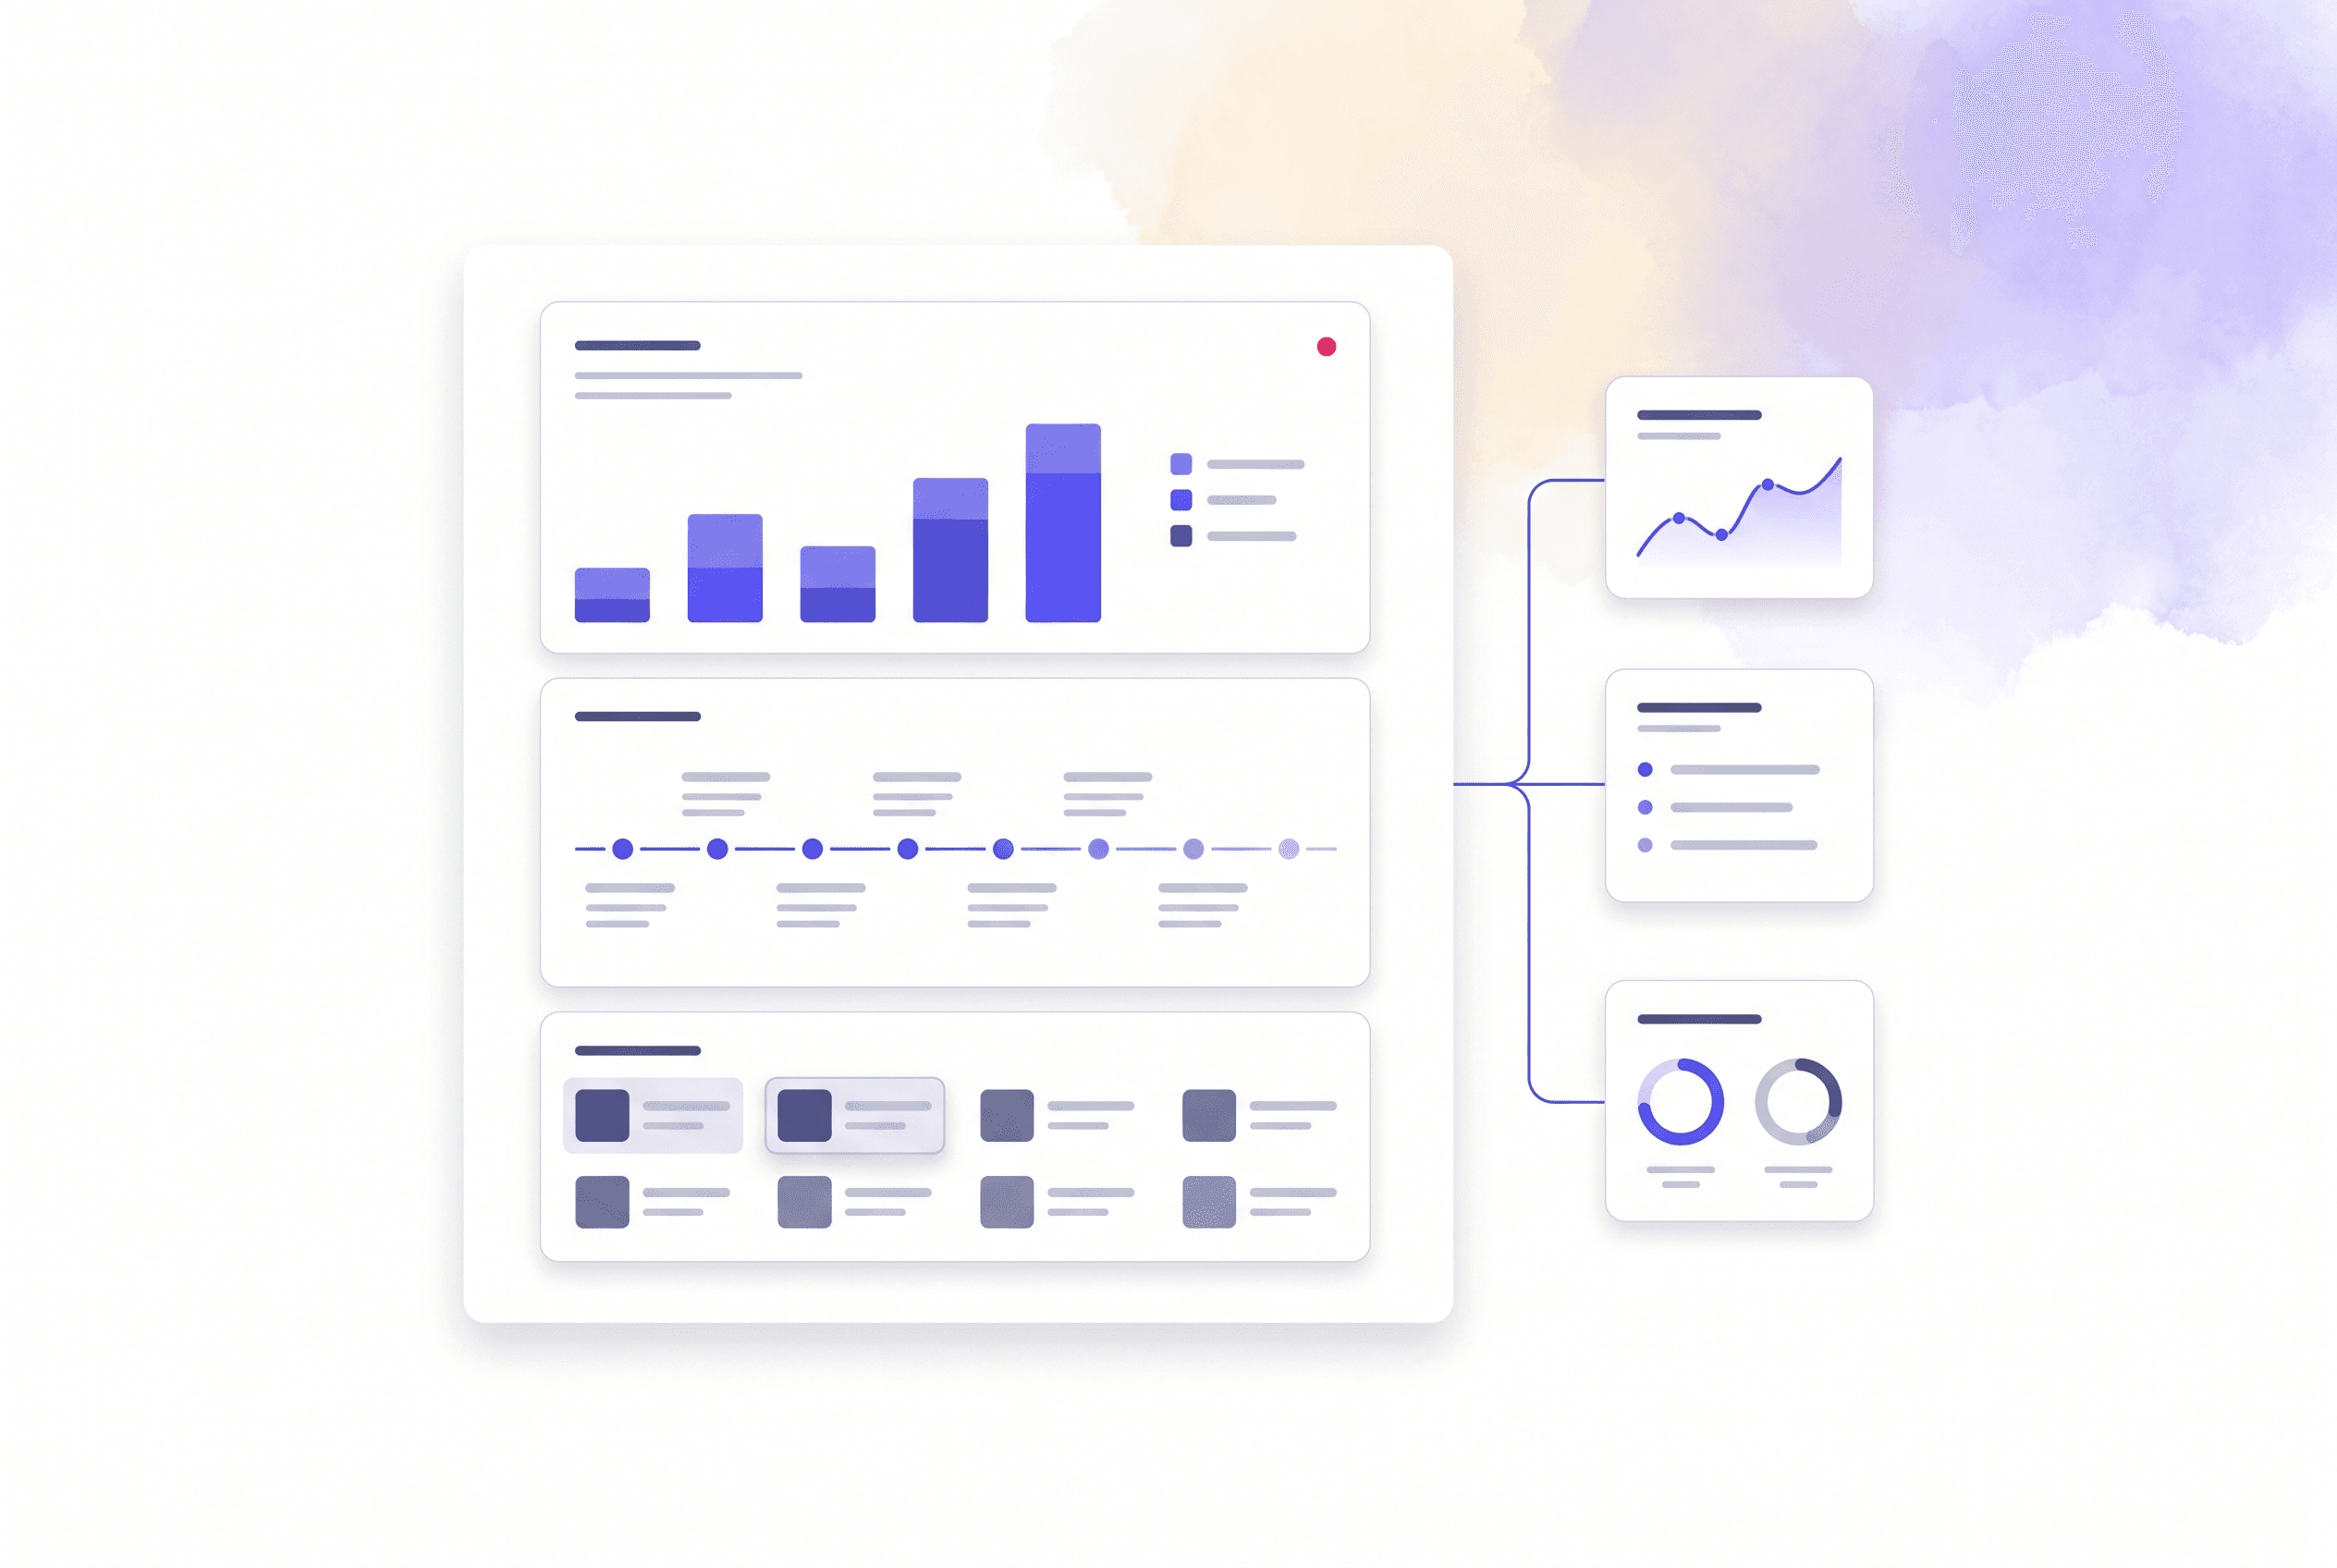
Almost every marketing operation has data to spare. A Meta Business tab for campaigns, an Instagram export for organic, a spreadsheet for competitors, a conclusions doc nobody opens on Tuesday. The time left over for deciding gets eaten up just pulling it all together. Manycontent's reports start from a simple premise: whoever decides on media investment needs to see organic, paid, and competitors on the same screen, with the same basis for comparison. The technology consolidates and updates all three streams on its own, and your account manager turns that reading into a decision together with you.
Organic traffic: what went up, what went down, and why.
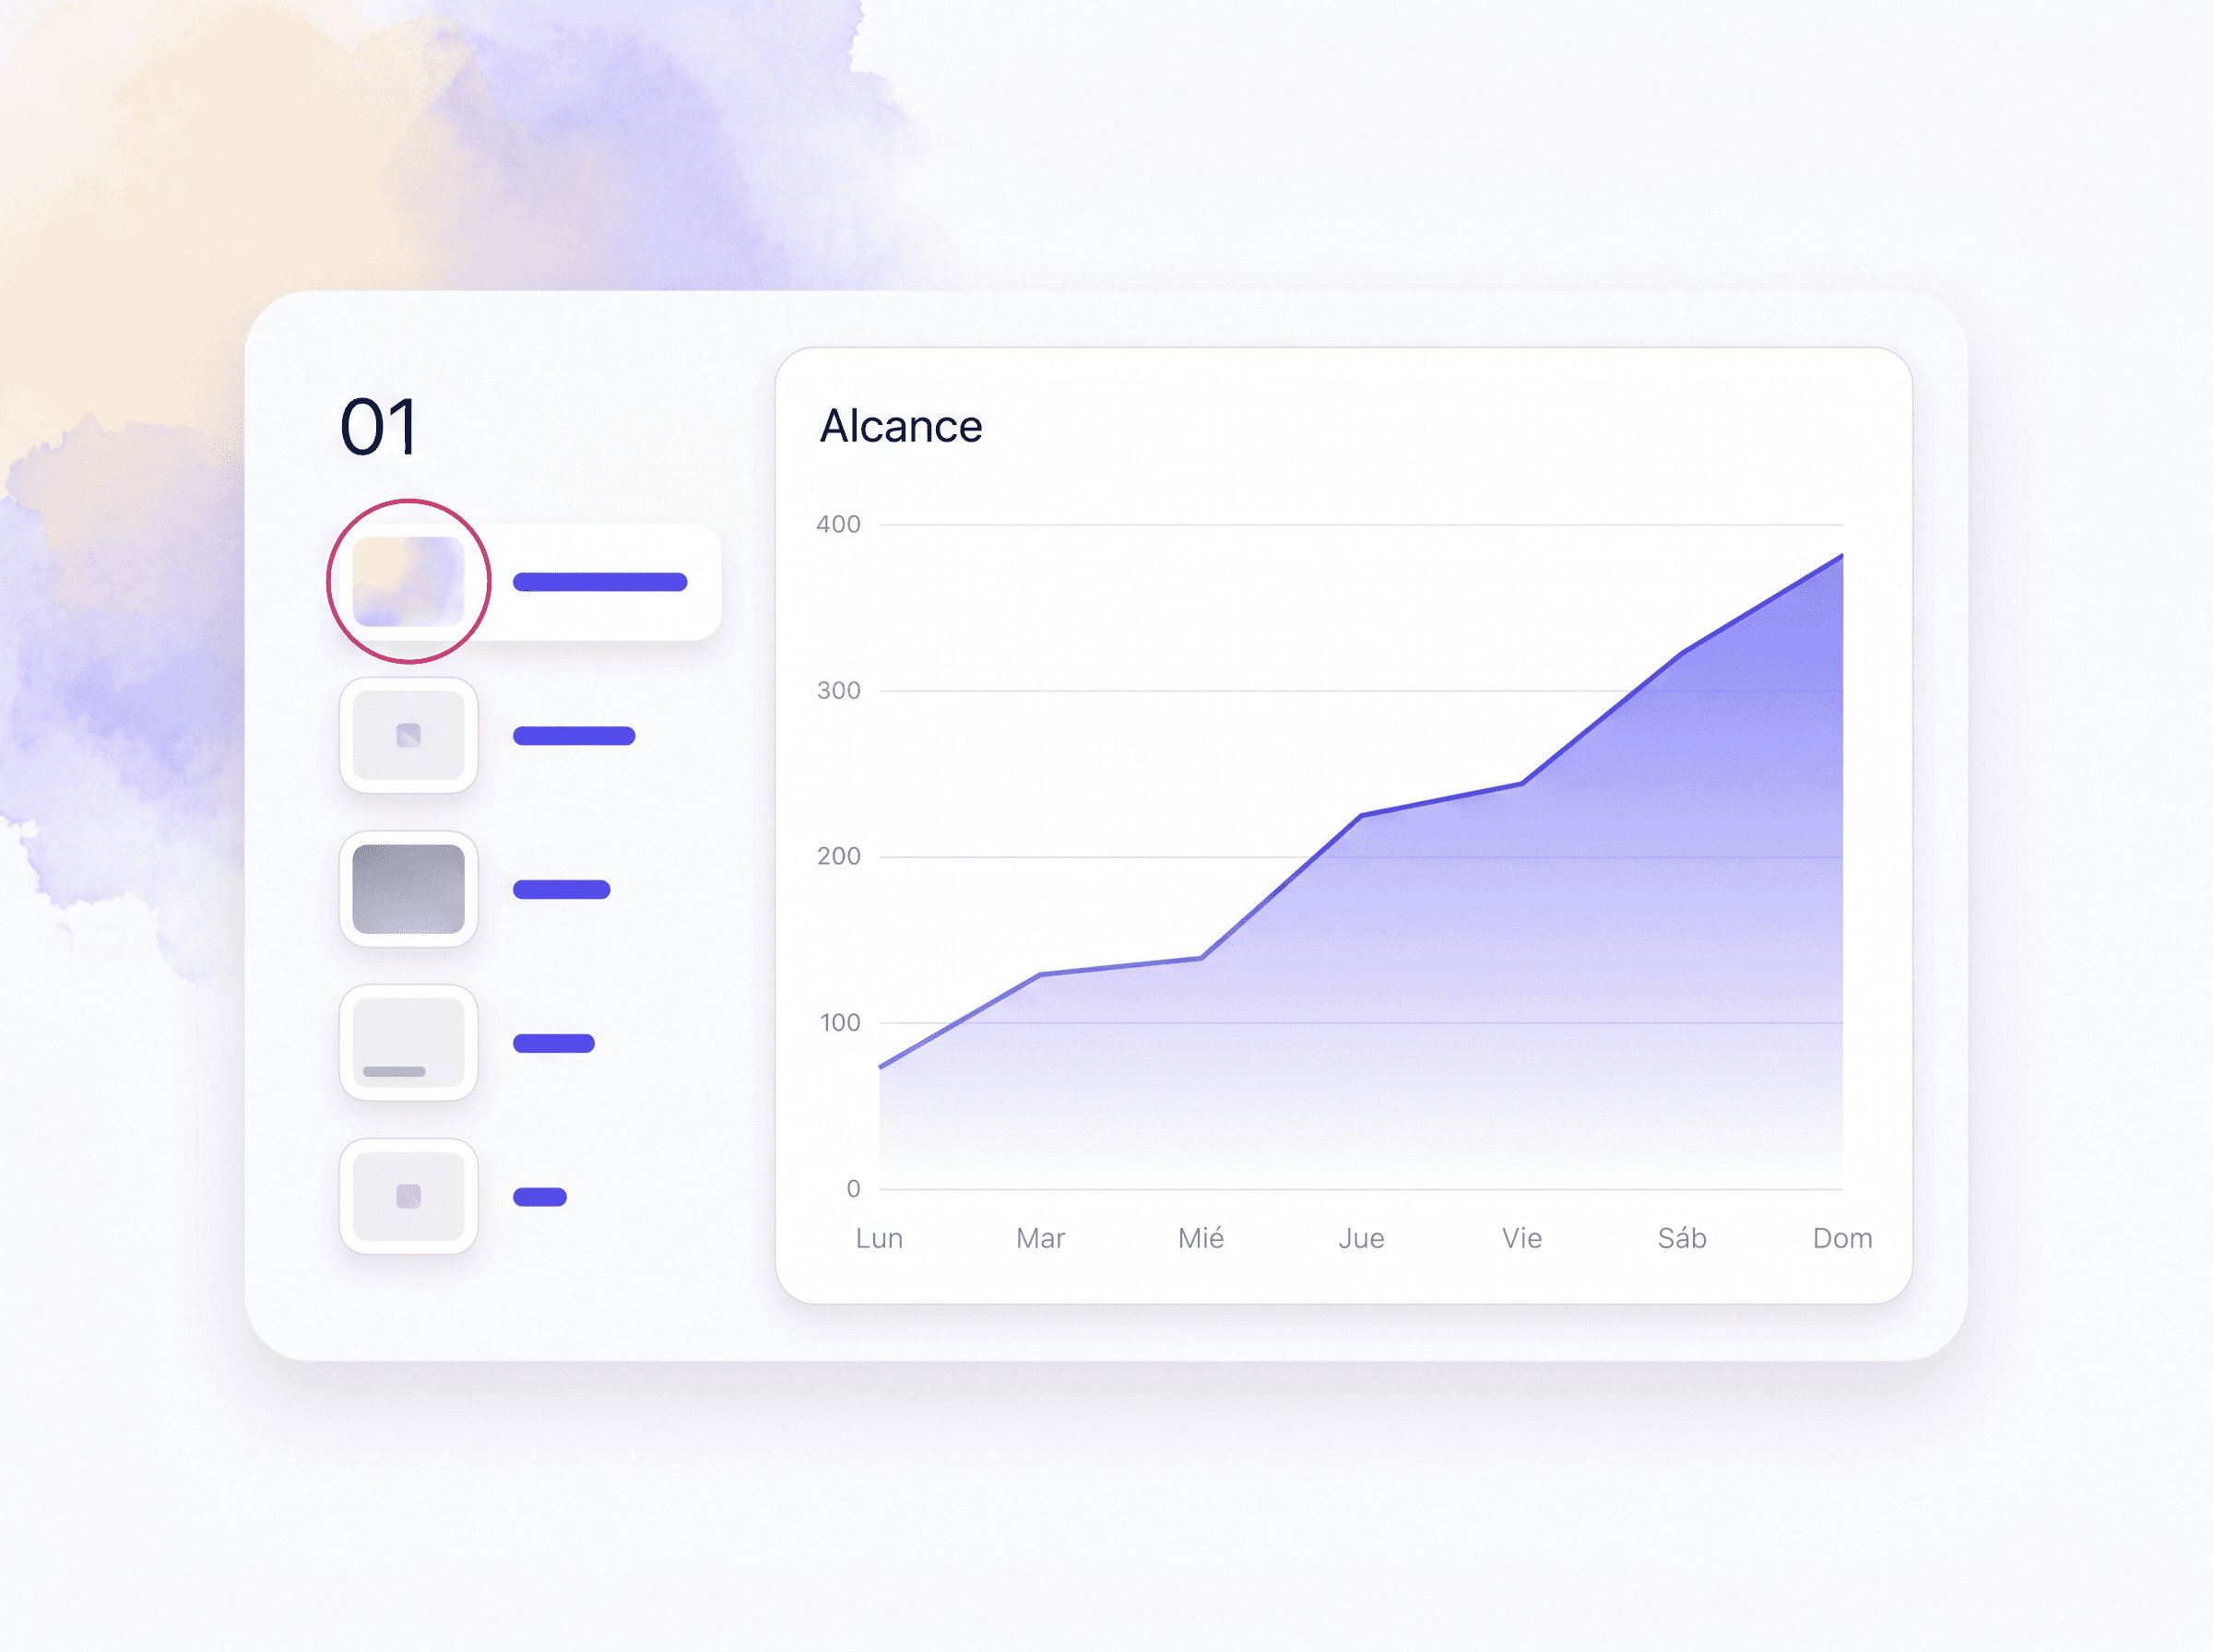
Reach, engagement, followers gained and lost, video retention, the format that drives comments, the format that drives saves. The organic report shows week by week which pieces moved the needle on Instagram and Facebook, with the metric next to the post that generated it. The dashboard stays open to your team, and your account manager flags in the check-in which Reel is worth repeating and which carousel was noise.
Paid media: where the money is delivering, where it's burning.
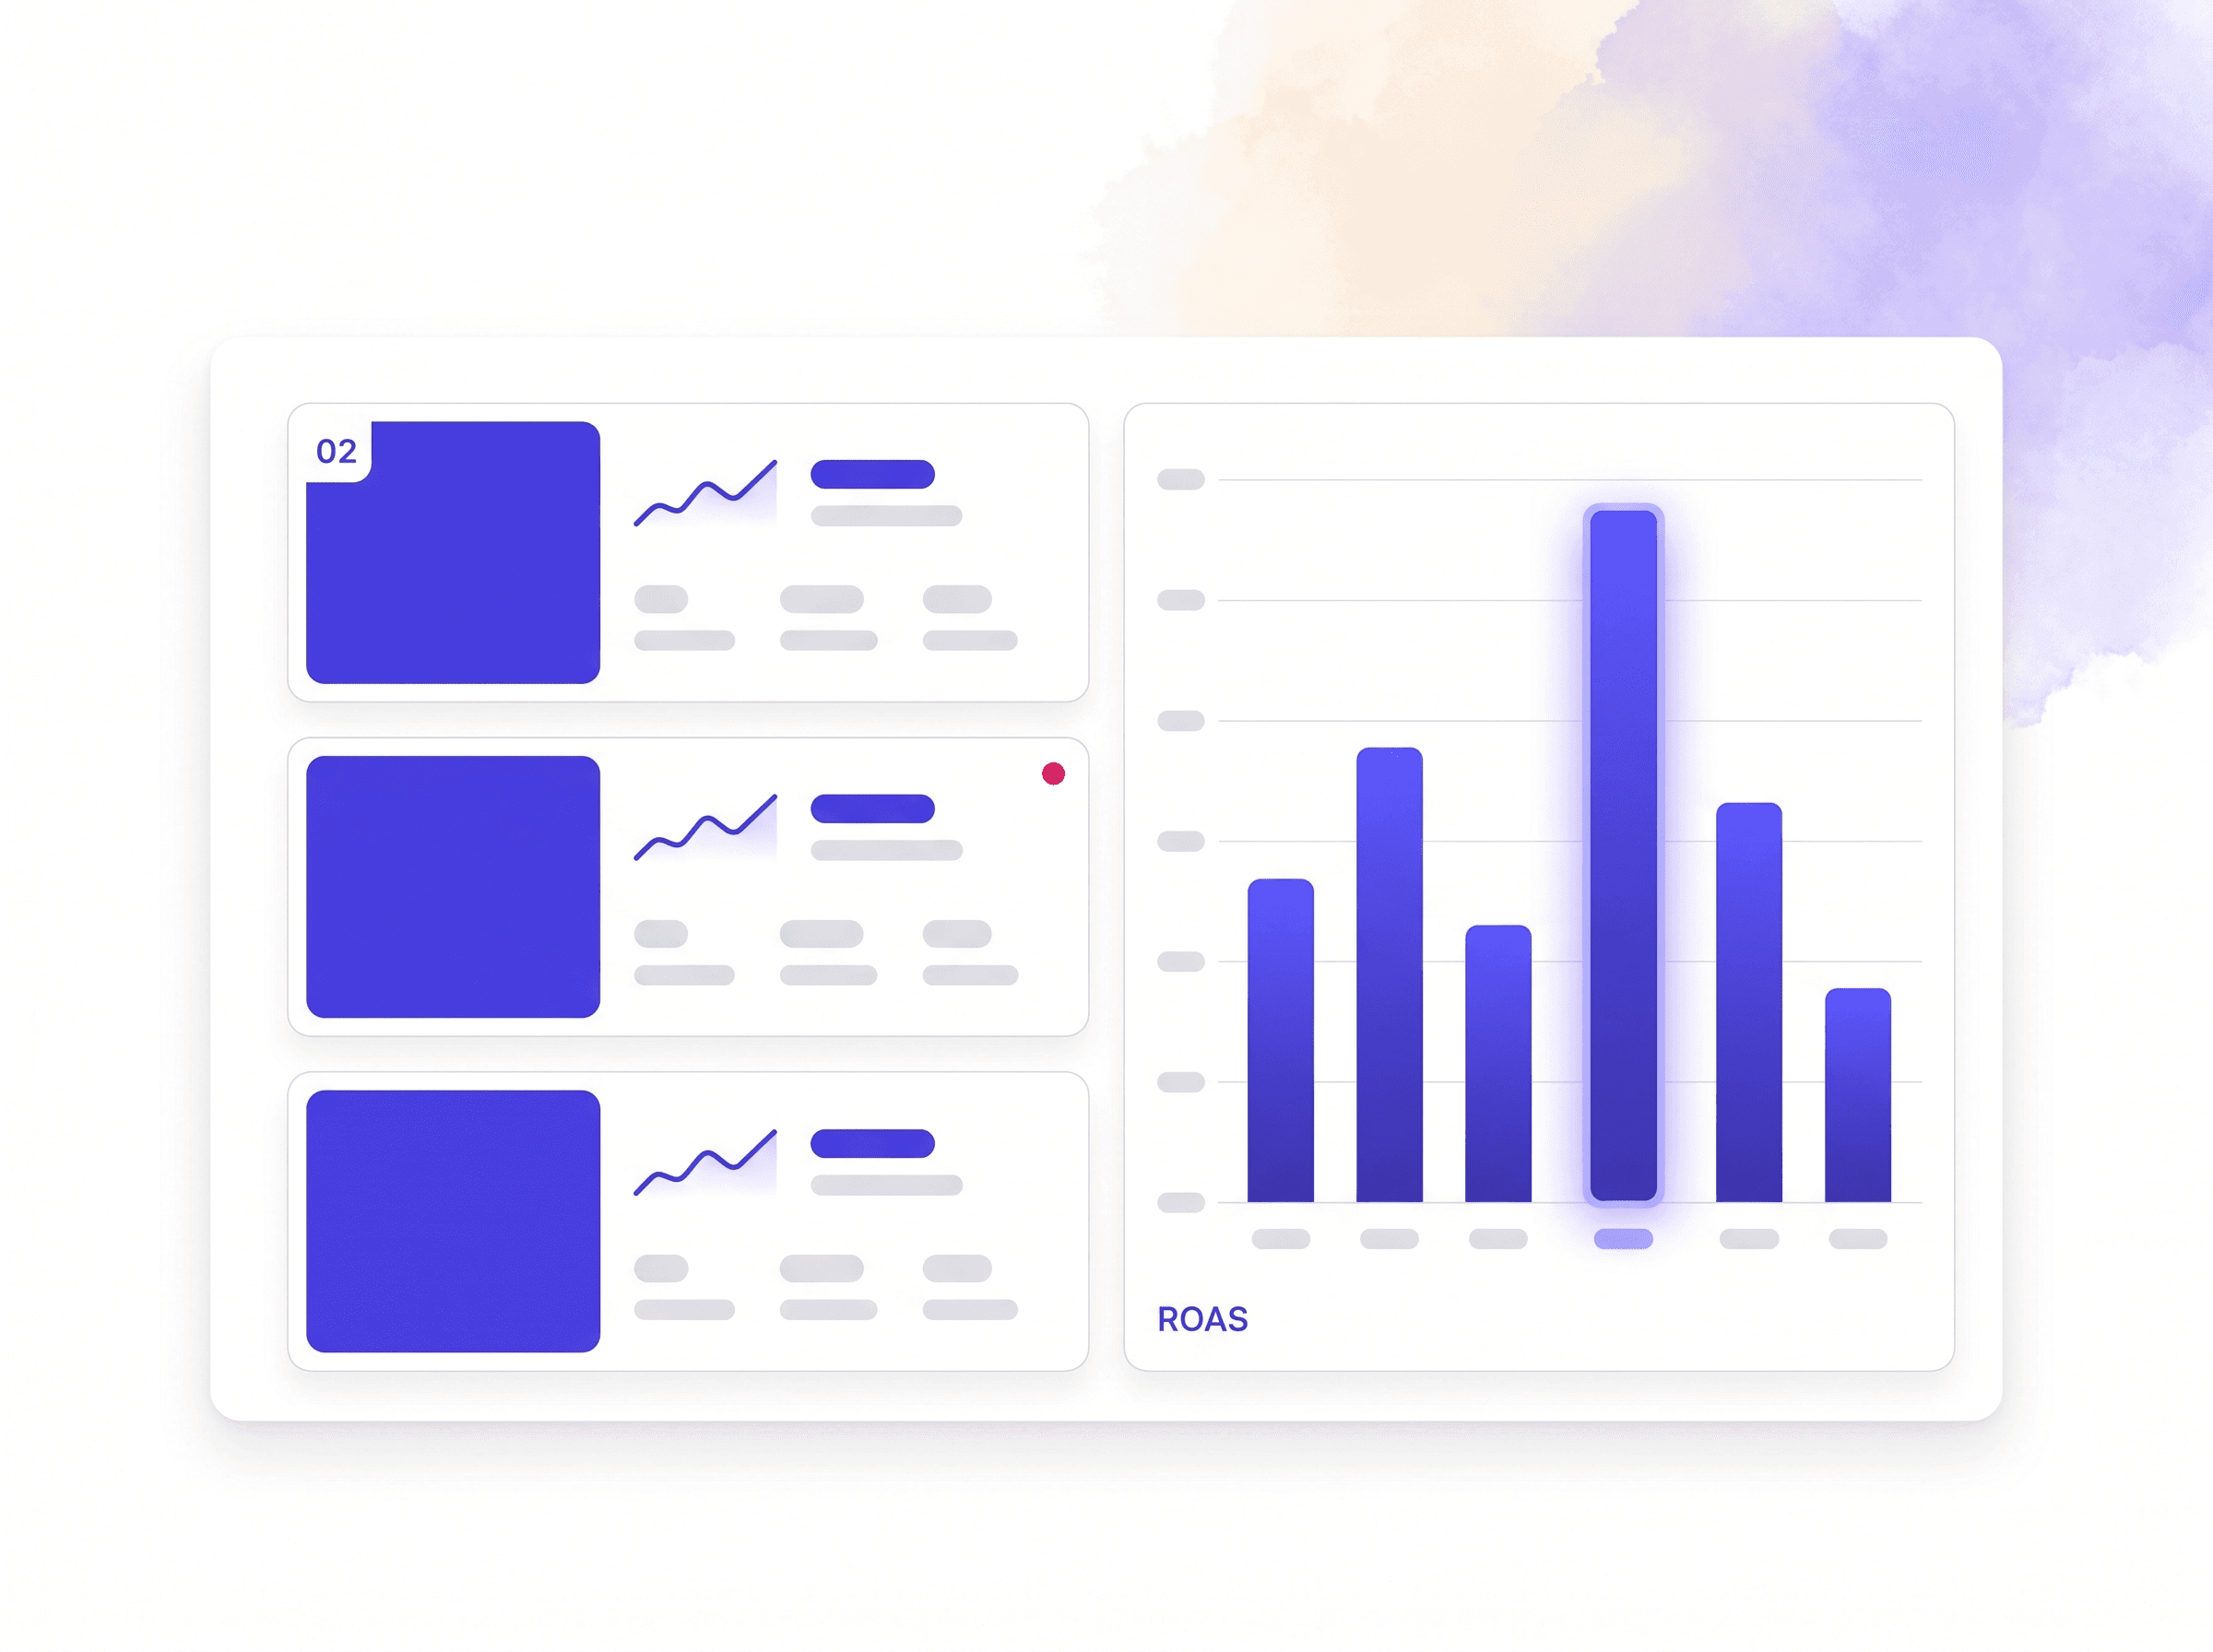
CPM, CTR, cost per result, and ROAS by campaign, ad set, and creative, cross-referenced with the real goal (sale, lead, DM). The paid report translates your Meta Ads account into the question finance actually asks: for every thousand reais invested, how much came back. A campaign that doesn't pay off gets pulled, a creative that scales gets reinforced, and those adjustments make it into the week's agenda with the operation.
Instagram competitors: what they're testing before you are.
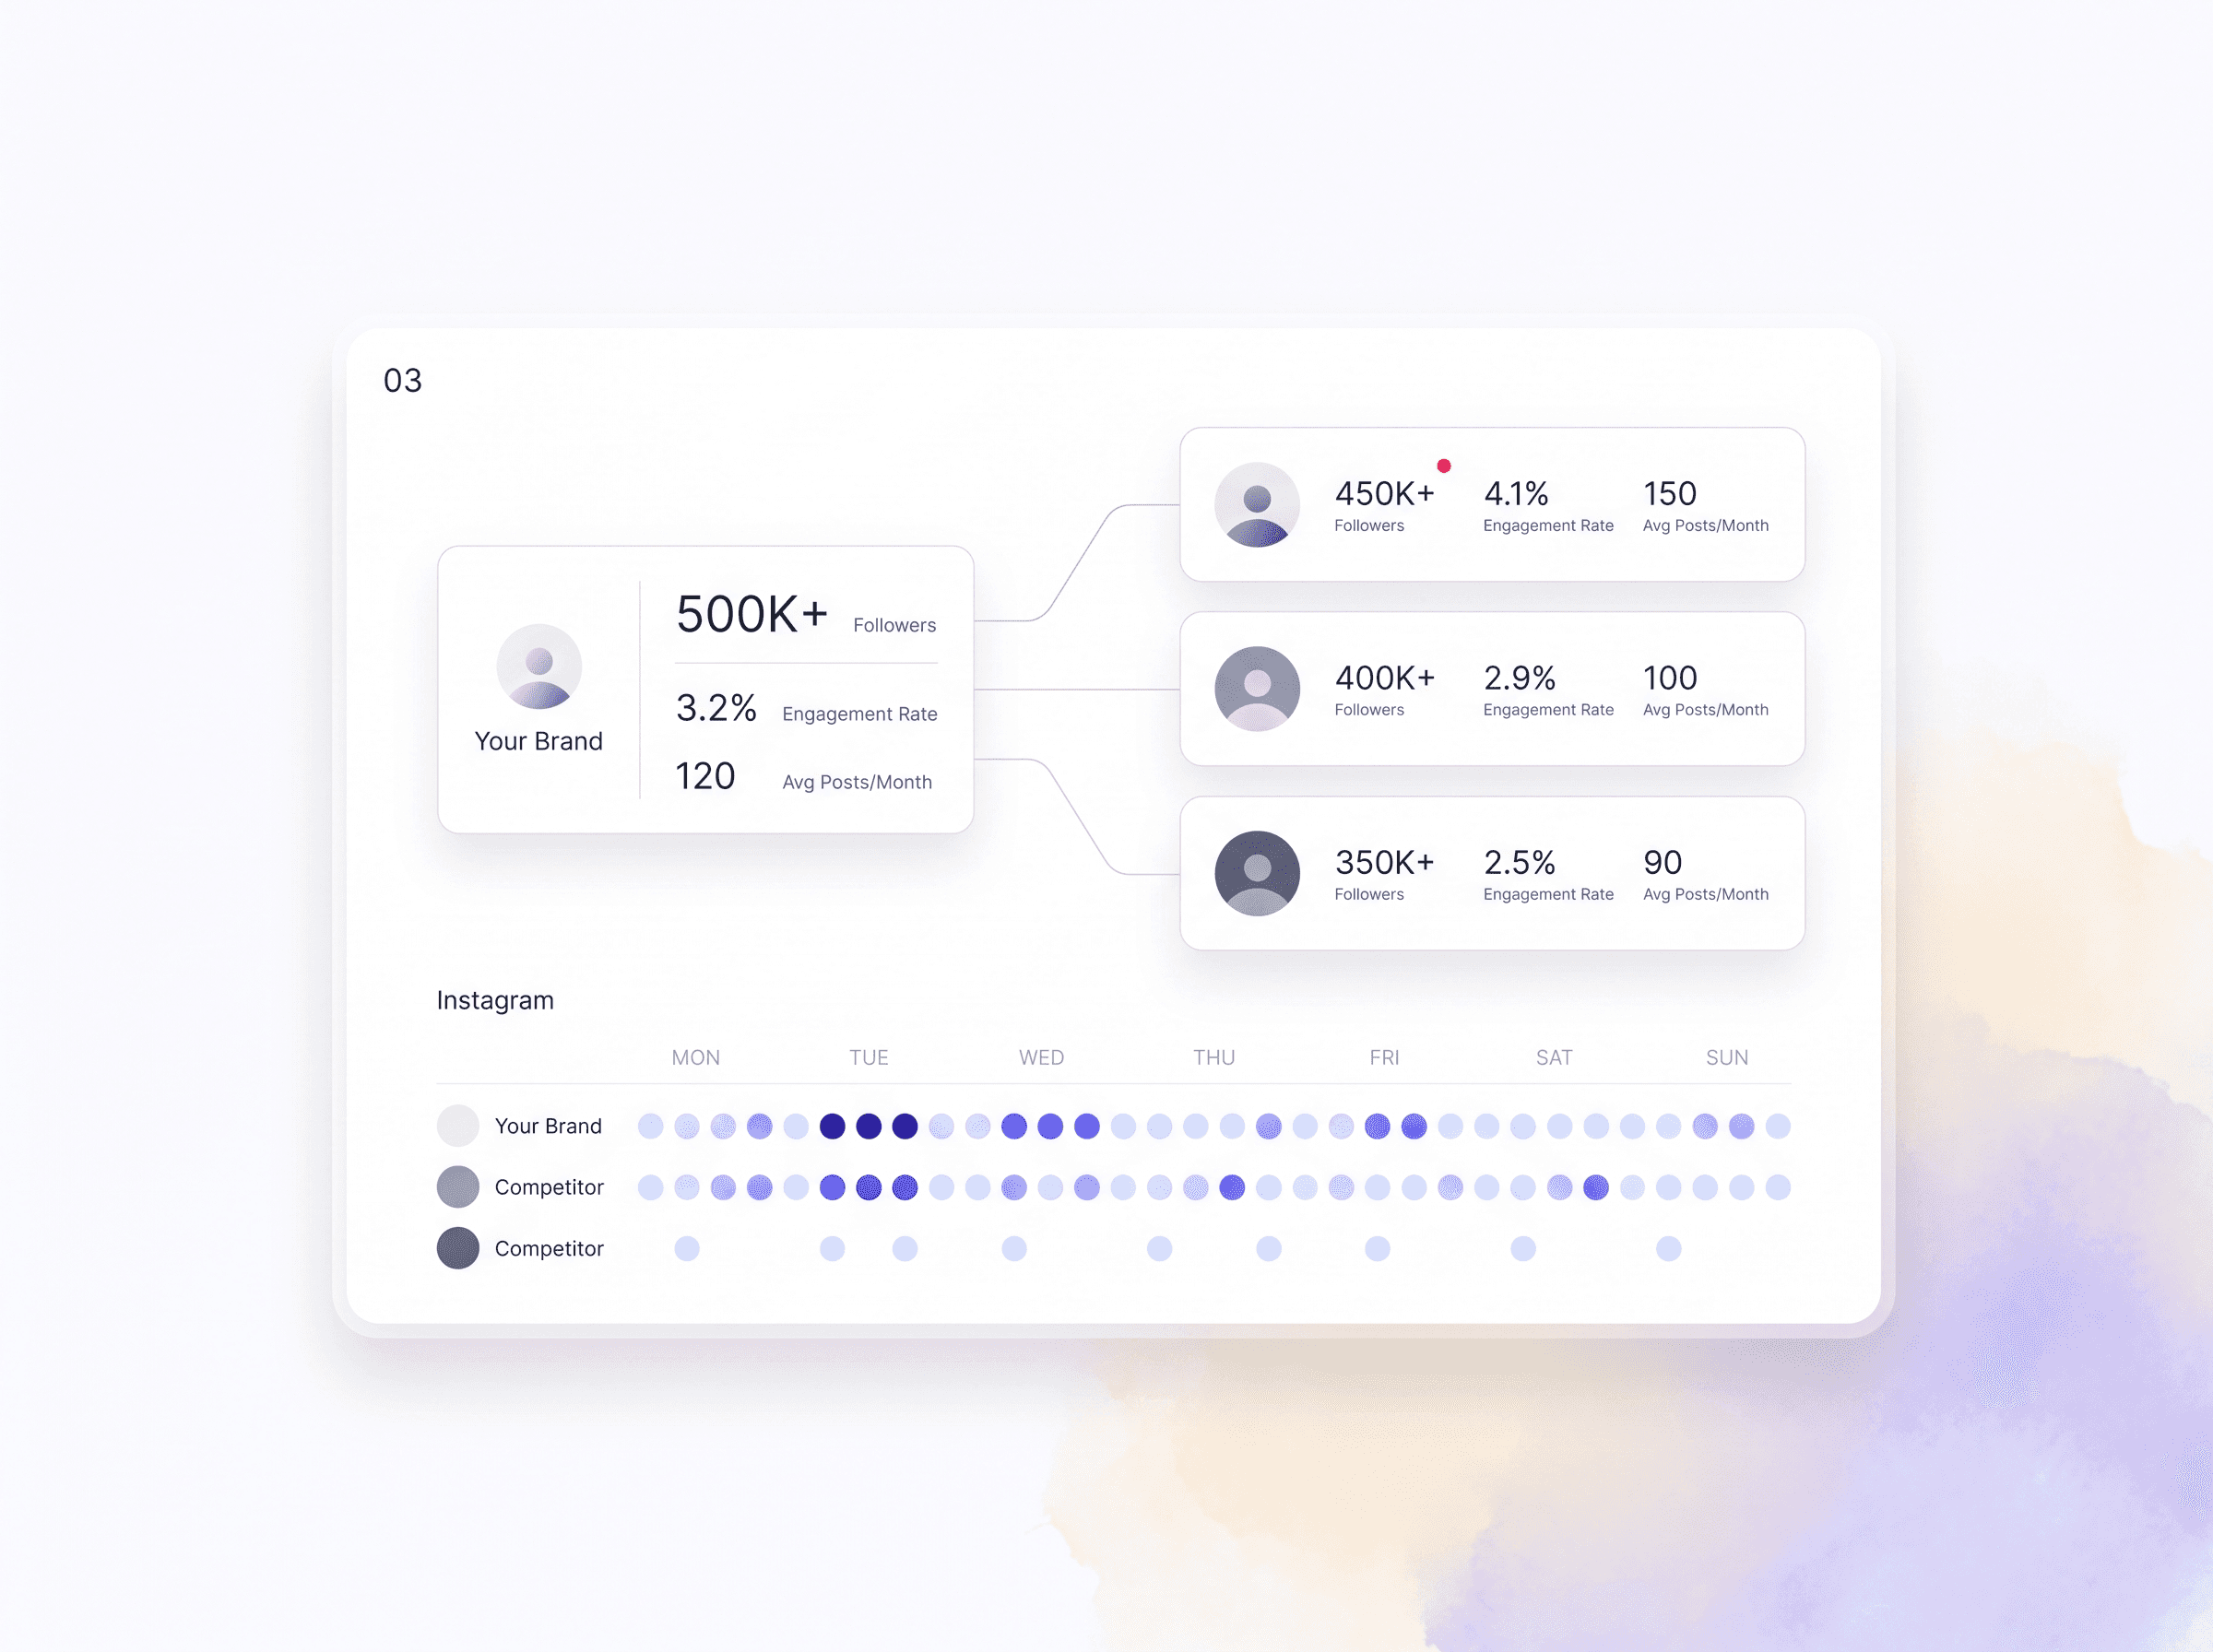
The operation continuously monitors the Instagram profiles you've defined as competitors: post frequency, dominant format, trending topics on their account, engagement per piece, and follower growth rate. A cosmetics shop discovers that a competitor tripled skincare-routine Reels and that before-and-after became the pattern of the week. You see the shift as it happens, not three months later.
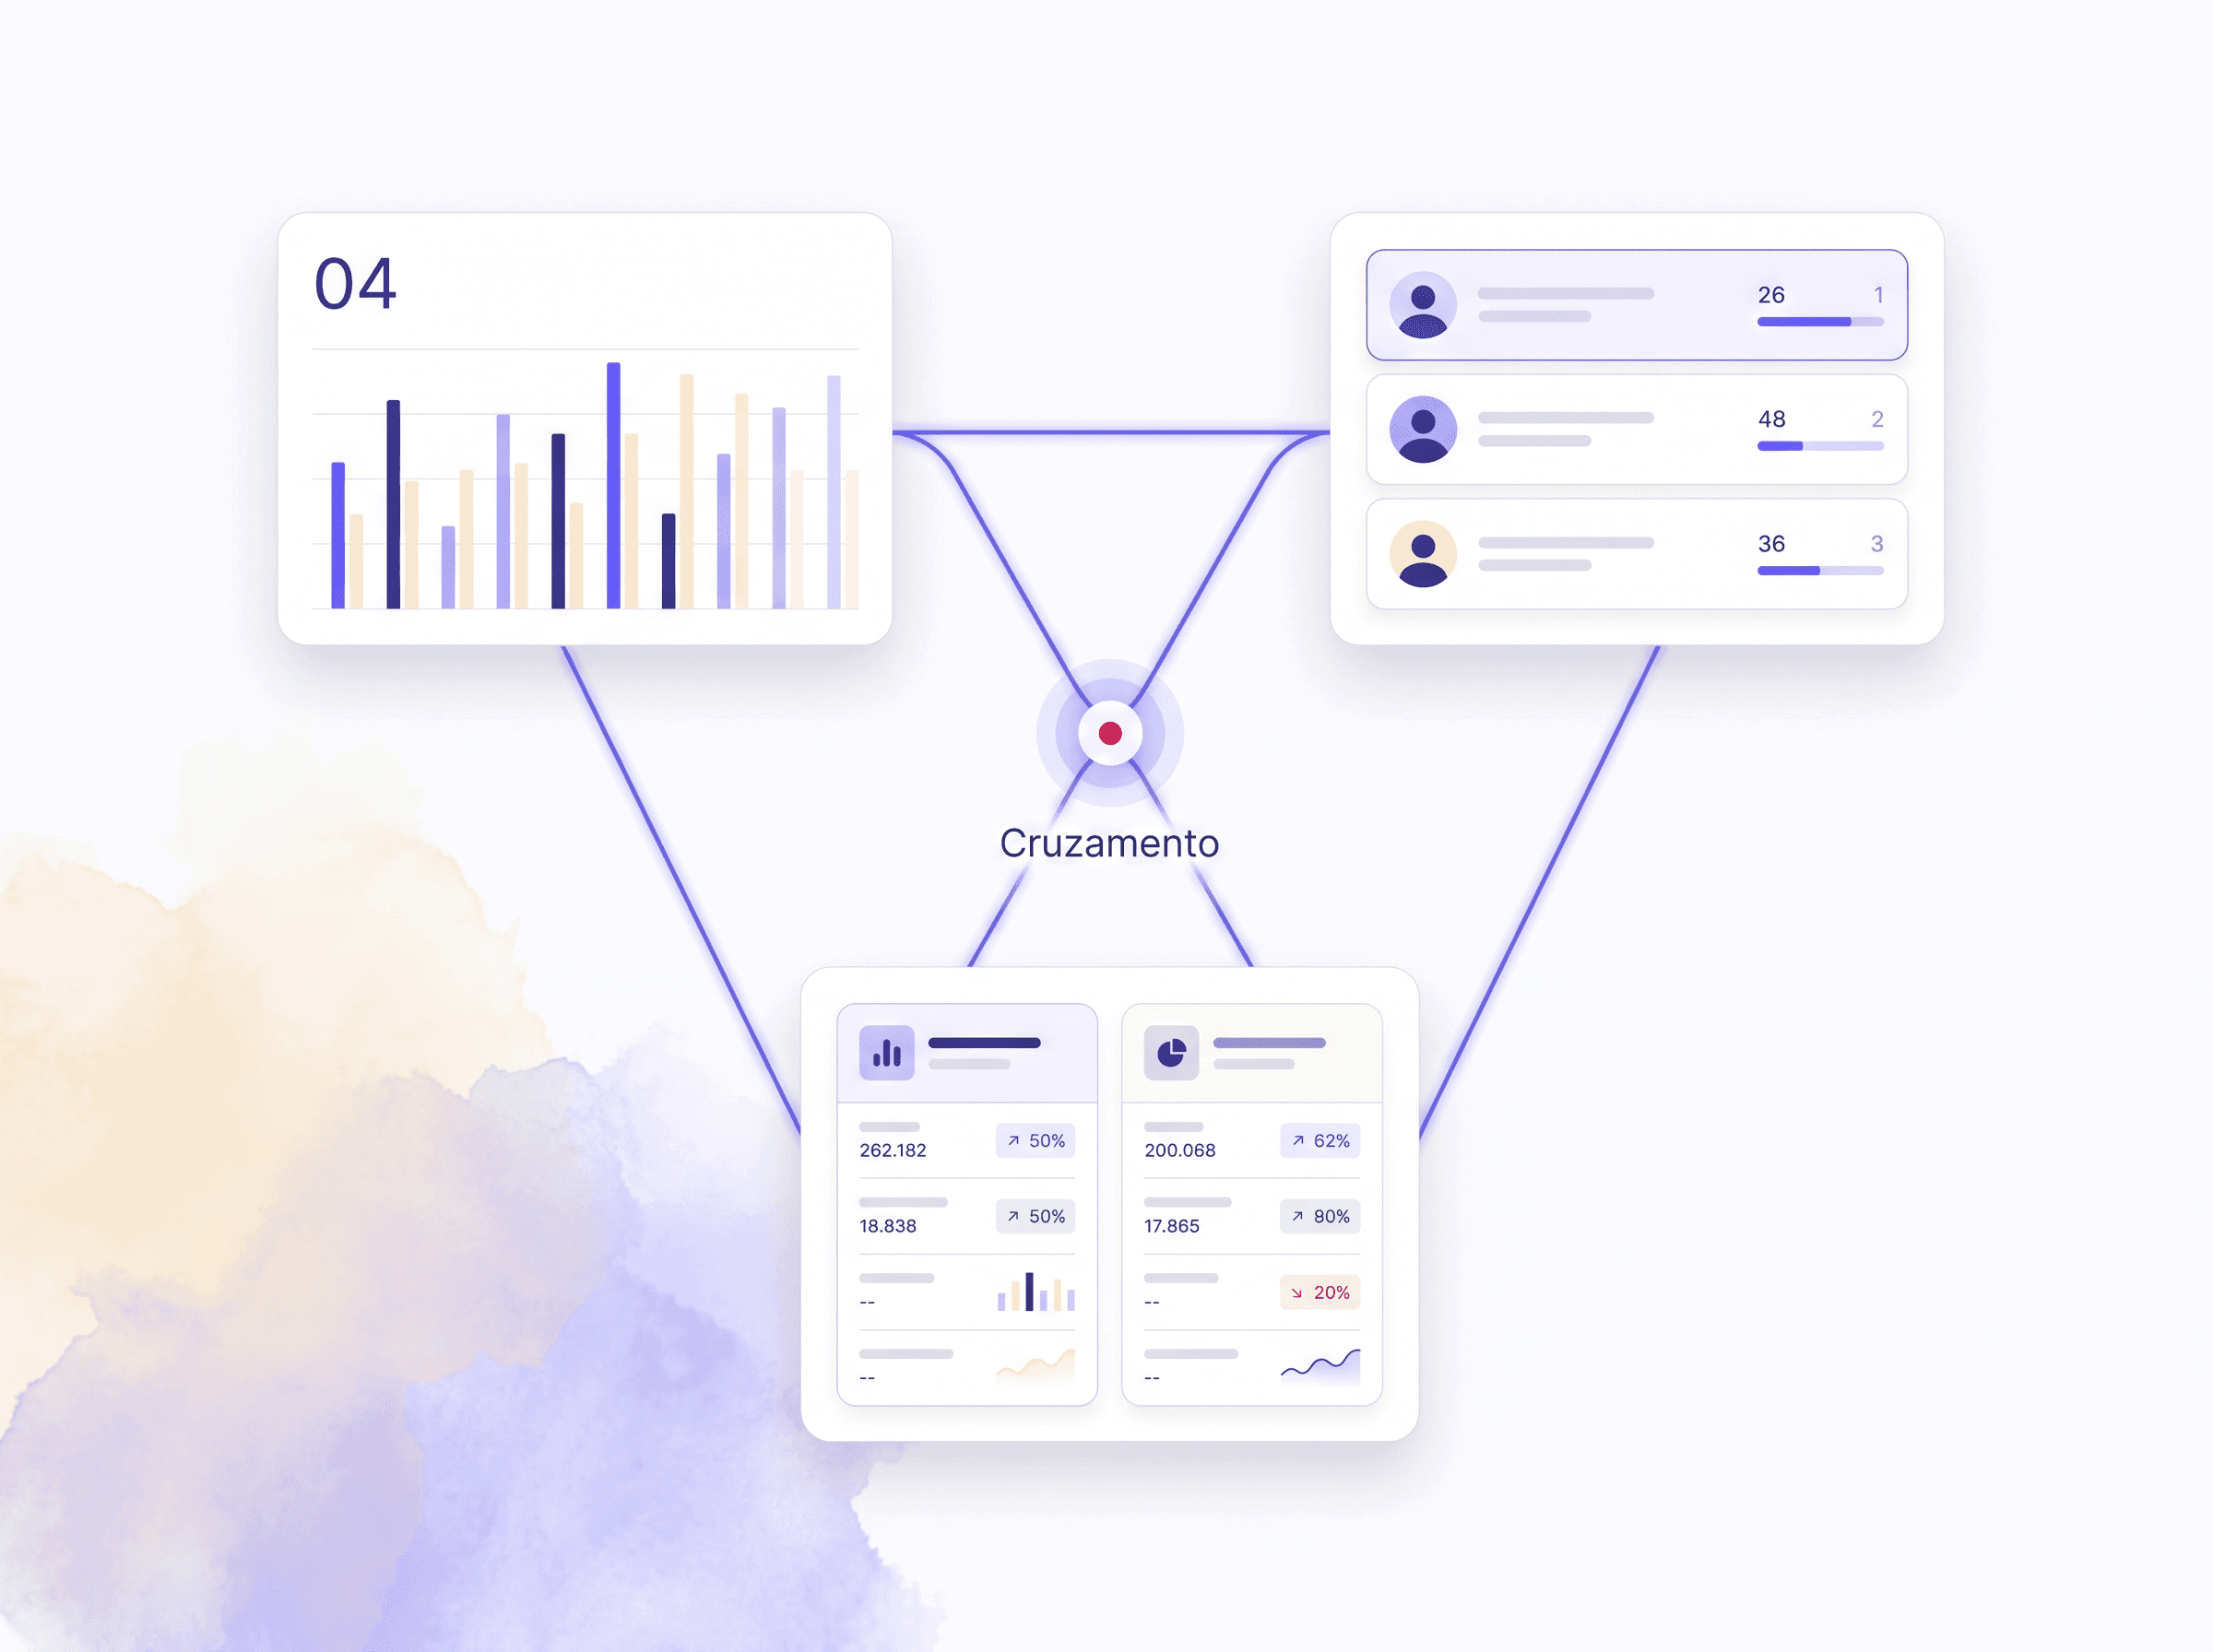
The three dashboards, talking to each other.
The Reel that engaged organically became an ad the following week, and the cost dropped. The topic a competitor started testing showed up in the audience's search behavior weeks later. That's the cross-referenced reading your account manager brings to the weekly check-in: what the market is doing, what your brand produces organically, and what comes back from paid investment, all on one screen.
The Monday meeting changes when the data arrives first.
Without a consolidated report, the weekly meeting starts with fifteen minutes of hunting for numbers. With the analysis ready in the check-in, it starts right on the question that matters: what are we testing this week. A financial advisory firm discovers that its retirement-planning carousel performed just as well as an ad that same month. A course creator finds that a competitor tripled Reels on a topic their own audience is already searching for. Each operation reaches a different conclusion from the same screen.
Frequently asked questions.
Organic and paid traffic on Instagram and Facebook, the two channels where most Brazilian businesses concentrate their investment. Competitor analysis is focused on Instagram in this version, and other networks get added as client demand prioritizes them.
You authorize access once, guided by our team during onboarding, and the platform starts pulling data on its own from there. No weekly export to a spreadsheet. With the ad account live, paid reports show up in the dashboard the same day.
No. The dashboard is available to your team at any time, and the analysis arrives ready in the weekly check-in: your account manager points out what went up, what went down, and what the operation will adjust because of it.
You define the profiles with our team, and the operation monitors post frequency, engagement, dominant topics, and growth rate, returning a side-by-side comparison with your account. The goal is to spot market movement before it becomes an established trend, never to copy.
Yes. Every report exports as a meeting-ready PDF or as CSV for anyone who prefers to open the numbers in their own spreadsheet. The dashboard inside the platform remains the live version, updated every day.
Daily for organic and paid, with automatic sync to Meta Business. For competitors, the cycle is daily for post frequency and engagement per piece, and weekly for the consolidated account snapshot.
Ready to see it in action?
An expert will show you how the operation would run in your business.